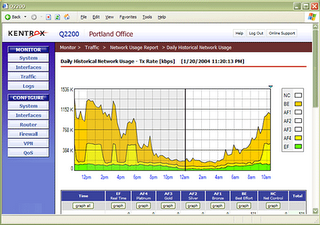
They've improved the graphs a great deal and the speed the graphs are produced. The scale for bandwidth usage is changeable for their x and y axis and the bandwidth graphs if clicked can be opened their own window. They actually seem faster when updating pages or moving from one screen to another.
Although I didn't check their site to see if they have change the cpu or supporting chips they definitely seemed quicker. I don't know how they will work for VoIP since in this case we are connecting the two offices through a VPN and QoS is out the window. The desktop connected to each of the networks just fine though and quite speedily. The IT guy at the office used remote desktop to connect in to the Florida office and said that the connection seemed quicker. Maybe Kentrox has been getting feedback about some of the inadequacies of the previous generation of units and has made some nice improvements.
Graphical QoS reports show application performance and traffic trends at a glance.

Learn more about the Kentrox Q-Series Router
Blog Home - http://remotesupportpc.blogspot.com/